swan river

Welcome to Swan River

Overview
Total Population 5930
Household Income $49,664
Median Age 46
Total Visible Minorities 150
Population

Population Population is the sum of births plus in-migration, and it signifies the total market size possible in the area. This is an important metric for economic developers to measure their economic health and investment attraction. Businesses also use this as a metric for market size when evaluating startup, expansion or relocation decisions.
Government of Manitoba Last Updated: April 2019
Gender

Gender Overall, women outnumber men by 280 people. The 15 to 19 years old age cohort exhibits the largest discrepancy with a difference of 20 people between the sexes. Furthermore, majority of the population is between the ages 20 to 24 years old, comprising 6.47 per cent of the population. Age-sex charts emphasize the gap between the numbers of males and females at a specific age group. It also illustrates the age and gender trends across all age and gender groupings. A chart skewed heavily to the left describes a very young population while a chart skewed heavily to the right illustrates an aging population. Statistics Canada. 2016 Census. Last Updated: May 2017
Marital Status
Marital Status Majority of the population are married, making up 43.91 per cent of the population. Having a predominantly married population is highy beneficial to Swan River, MB as married couples usually bring in larger incomes, higher net worth and gains on average. They also help boost the community's liveliness and labour force, as they are most likely to bear children and create the best economic conditions for them. Furthermore, this group also spends more compared to most of their counterparts. The marital status is another term for civil status, or person's current relationship with a partner.
Statistics Canada. 2016 Census.Last Updated: April 2017
Household Income
Household Income With a population at 4,014 people, most inhabitants at Swan River, MB are above the low income cut-off, or the income a person must earn to be considered to be part of the low income group. However, majority are below the 2016 median income of $49,664 per year. The household incomes chart shows how many household fall in each of the income brackets specified by Statistics Canada.
Statistics Canada. 2016 Census.Last Updated: September 2017
Aboriginal Identification
Aboriginal Identification The largest aboriginal population are that of the Metis, making up 58.06 per cent of the total aboriginal population. At 380 people, the second largest Aboriginal population is the First Nations. Inuit follows with 1.08% of the total Aboriginal population in Swan River, MB. The aboriginal populations chart shows the composition of the aboriginal population in a municipality.
Statistics Canada. 2016 Census.Last Updated: October 2017
Visible Minorities
Visible Minorities The largest visible minority population are that of the South Asian, making up 36.67 per cent of the total visible minority population. The second largest group are the Filipino, making up 35 people.Following Filipino is Chinese that is 16.67 per cent of the visible minority population. Number of people belonging to a visible minority group as defined by the Employment Equity Act and, if so, the visible minority group to which the person belongs. The Employment Equity Act defines visible minorities as 'persons, other than Aboriginal peoples, who are non-Caucasian in race or non-white in colour.' The visible minority population consists mainly of the following groups: South Asian, Chinese, Black, Filipino, Latin American, Arab, Southeast Asian, West Asian, Korean and Japanese.
Statistics Canada. 2016 Census.Last Updated: October 2017
Period of Immigration

Period of Immigration The largest influx of immigrants to Canada was 2011 to 2016, where 65 people surveyed called Canada their new home. Periods of migration shows how many people who entered Canada are currently residing in Swan River, MB.
Statistics Canada. 2016 Census.Last Updated: December 2017
Median Age
Swan River, MB has a median age of 45 years old. The median age indicates the age separating the population group into two halves of equal size.
Statistics Canada. 2016 Census.Last Updated: February 2017
Median Household Income
Median Household Income In Swan River, MB, the median household income is $49,664 per year. The median household income in Swan River, MB is lower than the national household median income in 2015. The median income indicates the income bracket separating the income earners into two halves of equal size.

Statistics Canada. 2016 Census.Last Updated: September 2017
House By Size
Overview
Total Labour Force 1,810
Employment Rate 55.7%
Participation Rate 58.6%
Unemployment Rate 4.9%
Overview
Federal General Corporate Tax 15%
Federal Investment Corporate Tax 15%
Federal Smal Business Corporate 9%
Federal Corporate Tax 15%
Federal Personal Income Tax
Provincial Personal Income Tax
Provincial Corporate Income Tax
Mill Rate
Overview
Average Yearly Rainfall(mm) 278
Average Yearly Snowfall(cm) 129
Highest Temperature (Celsius) 32
Lowest Temperature (Celsius) -38
Average Rainfall

Average Rainfall Umbrellas and raincoats are most handy in the month of July when it rains an average of 95 mm. This is 22.88% of the annual rain experienced in Swan River, MB. The month of June is also rainy with an average rainfall of 85.4 mm. Following June is August, when 76.8 mm is the average rainfall. The average rainfall chart shows the average amount of total rainfall, or amount of all liquid precipitation in millimetres (mm) such as rain, drizzle, freezing rain, and hail, observed at the location for each month of the specified year. Precipitation is measured using vertical depth of water (or water equivalent in the case of solid forms) which reaches the ground during a stated period.
Environment CanadaLast Updated: December 2019
Average Snowfall

Average Snowfall Wrap up in layers in the month of December when snow builds up tp an average of 23.8 centimetres. This is 18.46% of the annual snowfall experienced in Swan River, MB. The month of Janurary is also snowy with an average snowfall of 22.2 cm. Following Janurary is November, when 22.0 cm is the average snowfall.
The average snowfalls chart shows the average amount of snow an area gets in centimetres.
Environment CanadaLast Updated: November 2018
Average Temperature

Average Temperature It is coldest in Swan River, MB in January when temperature drops to -22.2 °C and warmest in the month of July when it hits 24.3 °C. It will be a good idea to always check temperatures and the weather around May when temperatures are more fickle that it changed by 13.4 °C in the same month in 2016. Temperatures are most stable in Swan River, MB in the month of November. The average temperature chart illustrates the range of recorded temperature for each month of the specified year. The temperature of the air in degrees Celsius (°C).
Environment CanadaLast Updated: December 2019
Overview

Number of Renters 710

Number of Home Owners

1,115

Most Popular Dwelling Size

2 Bdr

Least Popular Dwelling Size 1 Bdr or Less
Construction Period

Construction Period 38.74 per cent, which is majority of homes in Swan River, MB, were constructed between 1961 to 1980. Building and home construction was also brisk before 1960, where 405 homes were built. In between 1981 to 1990, 315 of homes were built too. Periods of construction chart illustrates the number of buildings or dwellings constructed for each time period.
Statistics Canada. 2016 Census.Last Updated: September 2017
Dwellings by Bedroom
Dwellings By Bedroom 32.59%, which is majority of homes in Swan River, MB, have two bedrooms. Homes with three bedrooms are also very popular, with 510 homes built with this number of bedrooms. The third largest category of homes according to number of bedrooms are 4 or more bedrooms representing 26.46 per cent of dwellings. Dwellings by number of bedrooms chart illustrates the most popular types of homes based of bedroom count.
Statistics Canada. 2016 Census.Last Updated: September 2017
Housing Type By Structure
Homes by Prices
Home Ownership
Time Leaving For Work

Time Leaving for Work Majority of commuters in Swan River, MB leave their homes from 8:00am to 8:59am, saying that it's enough time to get to work. The second most popular time to head to work, with 26.67% of respondents, is from 7:00am to 7:59am. However, 285 of commuters still prefer to leave from 6:00am to 6:59am. This chart display the most common time intervals workers leave to start commuting to work.
Statistics Canada. 2016 Census.Last Updated: December 2017
Modes of Transportation
Modes Of Transportation Majority of commuters, around 1,330 respondents in Swan River, MB, are carpooling in a private car, truck, or van to go to work. Moreover, 10.94% of respondents say that they prefer walking. The third most popular means of transportation is driving alone in a private car, truck, or van with 105 commuters preferring it. The modes of transportation chart illustrates residents' most popular choices when it comes to getting around the area.
Statistics Canada. 2016 Census.Last Updated: April 2017
Communting Duration
Commuting Destination
Overview
Most Popular Field of Study Health
Most Popular Educational Destination Canada
Least Popular Field of Study Mathematics
Education

Education Most people in Swan River, MB have have completed a high school education. With 935 people, it is what most people in Swan River, MB completed. Coming in second, 35.11% of inhabitants say they have not completed any certificate. The third largest group are people who have completed a university degree, with 325 people responding. Educational attainment refers to the highest degree of education an individual has completed, and this chart shows the number of residents for each level of education.
Statistics Canada. 2016 Census.Last Updated: November 2017
Major Field of Study

Major Field of Study Most are in Health & related fields with 320 people practicing it in Swan River, MB. Business, Management & Public Administration is another popular field of expertise, as 20.85% of inhabitants are involved in it. The third group are those who are in Engineering & related fields, with 230 people responding that it is their line of work. STEM (Science, Technology, Engineering, and Math) is expected to be a growing industry, however, Department of Finance confirms that Canada is lagging behind other Organisation for Economic Co-operation and Development (OECD) countries in terms of STEM graduates. Swan River, MB has 285 people or 22.01% of workers in STEM industries. The major field of study chart shows the predominant disciplines or areas of learning or training of a person's highest completed postsecondary certificate, diploma or degree classified by Statistics Canada.
Statistics Canada. 2016 Census.Last Updated: November 2017
Location of Study

Location of Study Majority of the population, which is around 91.37% of residents received their schooling from Canada. Another country where most residents received their schooling is the Philippines, making up 30 people. At 1.96 per cent, those who received their education from India is the third largest group. The location of studies chart shows the countries where residents received their schooling. It reflects the variety of educational background of a municipality's population.
Statistics Canada. 2016 Census.Last Updated: December 2017
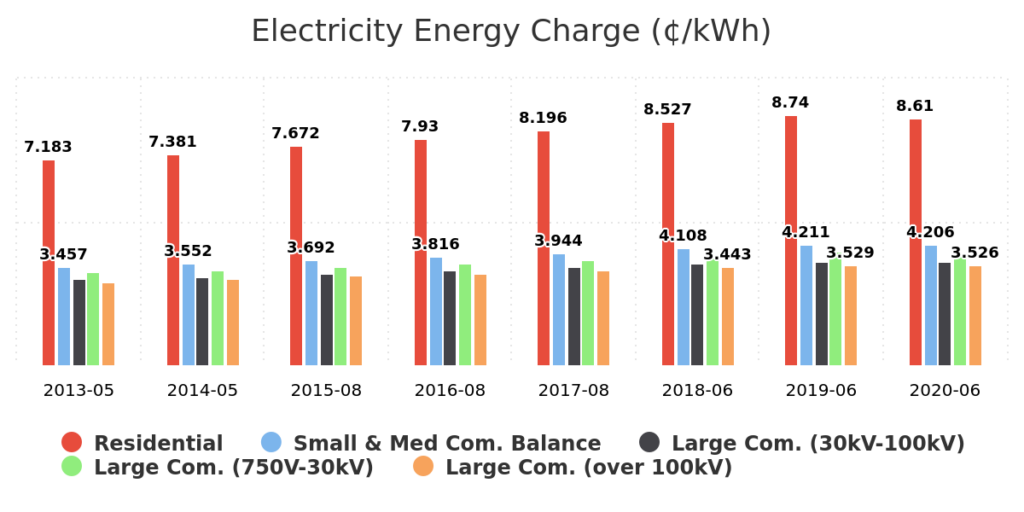
Electricity Energy Charge
electricity-energy-charge-¢_kwh-mb-electricity-energy-charge-¢_kwh
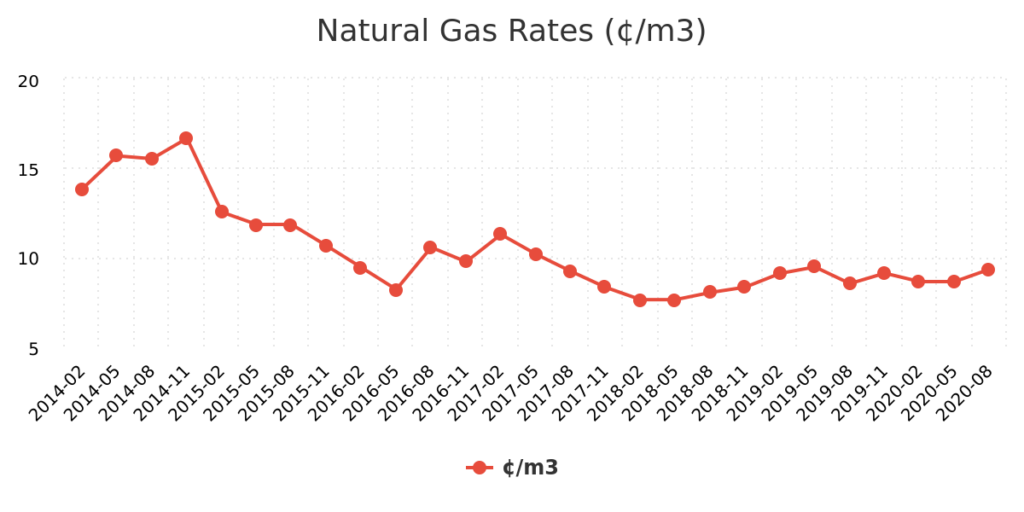
Natural Gas Rates
natural-gas-rates-¢_m3-mb-natural-gas-rates-¢_m3
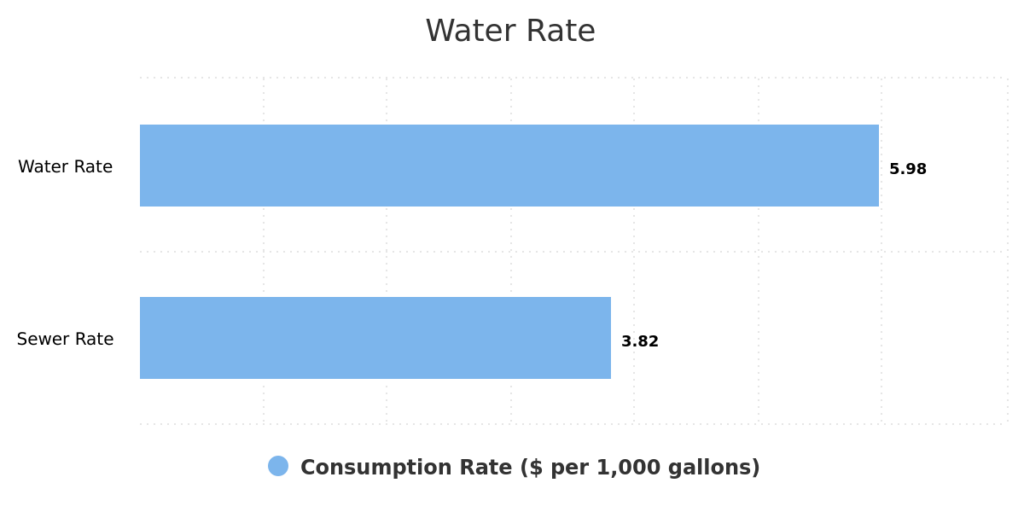
Water Rate
water-rate-mb-water-rate
Business Sizes
Business Sizes The business sizes chart shows the distribution of businesses according to the number of employees they employ. Definitions of what fall under a small, medium, or large business varies per country. However, in North America, small businesses are generally referred to have fewer than 100 employees, medium-sized businesses employing anywhere from 100 to 500 employees. Anywhere above 500 employees falls under large enterprises. The chart helps understand the profile of businesses in the region. Having a huge portion of businesses with a small workforce generally means that the municipality is more or less diversified, and that small and medium-sized enterprises have a huge influence on the municipality’s economy.
Statistics Canada. Business Register.Last Updated: February 2020
Business Industries

Welcome to Swan River

Overview
Total Population 5930
Household Income $49,664
Median Age 46
Total Visible Minorities 150
Population

Population Population is the sum of births plus in-migration, and it signifies the total market size possible in the area. This is an important metric for economic developers to measure their economic health and investment attraction. Businesses also use this as a metric for market size when evaluating startup, expansion or relocation decisions.
Government of Manitoba Last Updated: April 2019
Gender

Gender Overall, women outnumber men by 280 people. The 15 to 19 years old age cohort exhibits the largest discrepancy with a difference of 20 people between the sexes. Furthermore, majority of the population is between the ages 20 to 24 years old, comprising 6.47 per cent of the population. Age-sex charts emphasize the gap between the numbers of males and females at a specific age group. It also illustrates the age and gender trends across all age and gender groupings. A chart skewed heavily to the left describes a very young population while a chart skewed heavily to the right illustrates an aging population. Statistics Canada. 2016 Census. Last Updated: May 2017
Marital Status
Marital Status Majority of the population are married, making up 43.91 per cent of the population. Having a predominantly married population is highy beneficial to Swan River, MB as married couples usually bring in larger incomes, higher net worth and gains on average. They also help boost the community's liveliness and labour force, as they are most likely to bear children and create the best economic conditions for them. Furthermore, this group also spends more compared to most of their counterparts. The marital status is another term for civil status, or person's current relationship with a partner.
Statistics Canada. 2016 Census.Last Updated: April 2017
Household Income
Household Income With a population at 4,014 people, most inhabitants at Swan River, MB are above the low income cut-off, or the income a person must earn to be considered to be part of the low income group. However, majority are below the 2016 median income of $49,664 per year. The household incomes chart shows how many household fall in each of the income brackets specified by Statistics Canada.
Statistics Canada. 2016 Census.Last Updated: September 2017
Aboriginal Identification
Aboriginal Identification The largest aboriginal population are that of the Metis, making up 58.06 per cent of the total aboriginal population. At 380 people, the second largest Aboriginal population is the First Nations. Inuit follows with 1.08% of the total Aboriginal population in Swan River, MB. The aboriginal populations chart shows the composition of the aboriginal population in a municipality.
Statistics Canada. 2016 Census.Last Updated: October 2017
Visible Minorities
Visible Minorities The largest visible minority population are that of the South Asian, making up 36.67 per cent of the total visible minority population. The second largest group are the Filipino, making up 35 people.Following Filipino is Chinese that is 16.67 per cent of the visible minority population. Number of people belonging to a visible minority group as defined by the Employment Equity Act and, if so, the visible minority group to which the person belongs. The Employment Equity Act defines visible minorities as 'persons, other than Aboriginal peoples, who are non-Caucasian in race or non-white in colour.' The visible minority population consists mainly of the following groups: South Asian, Chinese, Black, Filipino, Latin American, Arab, Southeast Asian, West Asian, Korean and Japanese.
Statistics Canada. 2016 Census.Last Updated: October 2017
Period of Immigration

Period of Immigration The largest influx of immigrants to Canada was 2011 to 2016, where 65 people surveyed called Canada their new home. Periods of migration shows how many people who entered Canada are currently residing in Swan River, MB.
Statistics Canada. 2016 Census.Last Updated: December 2017
Median Age
Swan River, MB has a median age of 45 years old. The median age indicates the age separating the population group into two halves of equal size.
Statistics Canada. 2016 Census.Last Updated: February 2017
Median Household Income
Median Household Income In Swan River, MB, the median household income is $49,664 per year. The median household income in Swan River, MB is lower than the national household median income in 2015. The median income indicates the income bracket separating the income earners into two halves of equal size.
Statistics Canada. 2016 Census.Last Updated: September 2017
House By Size
Overview
Total Labour Force 1,810
Employment Rate 55.7%
Participation Rate 58.6%
Unemployment Rate 4.9%
Overview
Federal General Corporate Tax 15%
Federal Investment Corporate Tax 15%
Federal Smal Business Corporate 9%
Federal Corporate Tax 15%
Federal Personal Income Tax
Provincial Personal Income Tax
Provincial Corporate Income Tax
Mill Rate
Overview
Average Yearly Rainfall(mm) 278
Average Yearly Snowfall(cm) 129
Highest Temperature (Celsius) 32
Lowest Temperature (Celsius) -38
Average Rainfall

Average Rainfall Umbrellas and raincoats are most handy in the month of July when it rains an average of 95 mm. This is 22.88% of the annual rain experienced in Swan River, MB. The month of June is also rainy with an average rainfall of 85.4 mm. Following June is August, when 76.8 mm is the average rainfall. The average rainfall chart shows the average amount of total rainfall, or amount of all liquid precipitation in millimetres (mm) such as rain, drizzle, freezing rain, and hail, observed at the location for each month of the specified year. Precipitation is measured using vertical depth of water (or water equivalent in the case of solid forms) which reaches the ground during a stated period.
Environment CanadaLast Updated: December 2019
Average Snowfall

Average Snowfall Wrap up in layers in the month of December when snow builds up tp an average of 23.8 centimetres. This is 18.46% of the annual snowfall experienced in Swan River, MB. The month of Janurary is also snowy with an average snowfall of 22.2 cm. Following Janurary is November, when 22.0 cm is the average snowfall.
The average snowfalls chart shows the average amount of snow an area gets in centimetres.
Environment CanadaLast Updated: November 2018
Average Temperature

Average Temperature It is coldest in Swan River, MB in January when temperature drops to -22.2 °C and warmest in the month of July when it hits 24.3 °C. It will be a good idea to always check temperatures and the weather around May when temperatures are more fickle that it changed by 13.4 °C in the same month in 2016. Temperatures are most stable in Swan River, MB in the month of November. The average temperature chart illustrates the range of recorded temperature for each month of the specified year. The temperature of the air in degrees Celsius (°C).
Environment CanadaLast Updated: December 2019
Overview

Number of Renters 710

Number of Home Owners

1,115

Most Popular Dwelling Size

2 Bdr

Least Popular Dwelling Size 1 Bdr or Less
Construction Period

Construction Period 38.74 per cent, which is majority of homes in Swan River, MB, were constructed between 1961 to 1980. Building and home construction was also brisk before 1960, where 405 homes were built. In between 1981 to 1990, 315 of homes were built too. Periods of construction chart illustrates the number of buildings or dwellings constructed for each time period.
Statistics Canada. 2016 Census.Last Updated: September 2017
Dwellings by Bedroom
Dwellings By Bedroom 32.59%, which is majority of homes in Swan River, MB, have two bedrooms. Homes with three bedrooms are also very popular, with 510 homes built with this number of bedrooms. The third largest category of homes according to number of bedrooms are 4 or more bedrooms representing 26.46 per cent of dwellings. Dwellings by number of bedrooms chart illustrates the most popular types of homes based of bedroom count.
Statistics Canada. 2016 Census.Last Updated: September 2017
Housing Type By Structure
Homes by Prices
Home Ownership
Time Leaving For Work

Time Leaving for Work Majority of commuters in Swan River, MB leave their homes from 8:00am to 8:59am, saying that it's enough time to get to work. The second most popular time to head to work, with 26.67% of respondents, is from 7:00am to 7:59am. However, 285 of commuters still prefer to leave from 6:00am to 6:59am. This chart display the most common time intervals workers leave to start commuting to work.
Statistics Canada. 2016 Census.Last Updated: December 2017
Modes of Transportation
Modes Of Transportation Majority of commuters, around 1,330 respondents in Swan River, MB, are carpooling in a private car, truck, or van to go to work. Moreover, 10.94% of respondents say that they prefer walking. The third most popular means of transportation is driving alone in a private car, truck, or van with 105 commuters preferring it. The modes of transportation chart illustrates residents' most popular choices when it comes to getting around the area.
Statistics Canada. 2016 Census.Last Updated: April 2017
Communting Duration
Commuting Destination
Overview
Most Popular Field of Study Health
Most Popular Educational Destination Canada
Least Popular Field of Study Mathematics
Education

Education Most people in Swan River, MB have have completed a high school education. With 935 people, it is what most people in Swan River, MB completed. Coming in second, 35.11% of inhabitants say they have not completed any certificate. The third largest group are people who have completed a university degree, with 325 people responding. Educational attainment refers to the highest degree of education an individual has completed, and this chart shows the number of residents for each level of education.
Statistics Canada. 2016 Census.Last Updated: November 2017
Major Field of Study

Major Field of Study Most are in Health & related fields with 320 people practicing it in Swan River, MB. Business, Management & Public Administration is another popular field of expertise, as 20.85% of inhabitants are involved in it. The third group are those who are in Engineering & related fields, with 230 people responding that it is their line of work. STEM (Science, Technology, Engineering, and Math) is expected to be a growing industry, however, Department of Finance confirms that Canada is lagging behind other Organisation for Economic Co-operation and Development (OECD) countries in terms of STEM graduates. Swan River, MB has 285 people or 22.01% of workers in STEM industries. The major field of study chart shows the predominant disciplines or areas of learning or training of a person's highest completed postsecondary certificate, diploma or degree classified by Statistics Canada.
Statistics Canada. 2016 Census.Last Updated: November 2017
Location of Study

Location of Study Majority of the population, which is around 91.37% of residents received their schooling from Canada. Another country where most residents received their schooling is the Philippines, making up 30 people. At 1.96 per cent, those who received their education from India is the third largest group. The location of studies chart shows the countries where residents received their schooling. It reflects the variety of educational background of a municipality's population.
Statistics Canada. 2016 Census.Last Updated: December 2017
Electricity Energy Charge
electricity-energy-charge-¢_kwh-mb-electricity-energy-charge-¢_kwh
Natural Gas Rates
natural-gas-rates-¢_m3-mb-natural-gas-rates-¢_m3
Water Rate
water-rate-mb-water-rate
Business Sizes
Business Sizes The business sizes chart shows the distribution of businesses according to the number of employees they employ. Definitions of what fall under a small, medium, or large business varies per country. However, in North America, small businesses are generally referred to have fewer than 100 employees, medium-sized businesses employing anywhere from 100 to 500 employees. Anywhere above 500 employees falls under large enterprises. The chart helps understand the profile of businesses in the region. Having a huge portion of businesses with a small workforce generally means that the municipality is more or less diversified, and that small and medium-sized enterprises have a huge influence on the municipality’s economy.
Statistics Canada. Business Register.Last Updated: February 2020
Business Industries